The Nation's report card vs The Visual Display of Quantitative Information: Which Should You Read?
Both live on shelves: Statistics, Science
vs
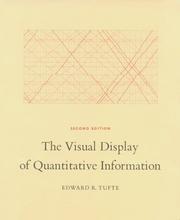 The Visual Display of Quantitative Information
“Excellence in statistical graphics consists of complex ideas communicated with clarity, precision, and efficiency.”
The classic book on statistical graphics, charts, tables. Theory and practice in the design of data graphics, 250 illustrations of the best (and a few of the worst) statistical graphics, with detailed analysis of how to…
The verdict
- The Nation's report card is the quickest read — about 1 hours vs 3 for The Visual Display of Quantitative Information.
How to choose
Scores by source
| The Nation's report card | The Visual Display of Quantitative Information | |
|---|---|---|
| Hardcover | — | 4.5 (78) |
Reception
| The Nation's report card | The Visual Display of Quantitative Information | |
|---|---|---|
| Ratings | — | 78 |
| Editions | 45 | 14 |
| Wikipedia attention | — | 3958 |
| Pages | 30 | 197 |